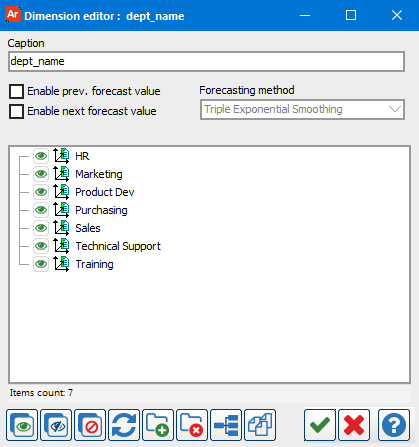
OLAP Data Cube - Dimension editor
Report viewers can manipulate the dimensions of an OLAP cube at run time. The dimension editor allows you to specify the caption, forecasting method, visibility, and filtering for each dimension.
When you apply a filter to a dimension at run time, the button for that dimension changes color. If at least one value in the dimension is set to a filtered state (![]() ) then the dimension button will be green. If the items are only set to invisible (
) then the dimension button will be green. If the items are only set to invisible (![]() ) then the dimension button will be blue.
) then the dimension button will be blue.

Dimension Editor Tools
- Dimension values list - The main window lists all values for the current dimension. Toggle the check box to the left of each value to control how it should be treated (visible, invisible, or filtered).
- Enable next forecast value - Predict and display future results based on the current data. If checked, you must select a forecasting method in the drop down box.
- Enable prev. forecast value -Estimate historical data based on the current data. If checked, you must select a forecasting method in the drop down box.
- Caption - Change the caption or title of the dimension button as it appears in the row, column or available dimensions section.
| Icon | Description |
|---|---|
|
|
Visible: The dimension value appears in the cube and is included in the calculated measures. |
|
|
Invisible: The dimension value does not appear in the cube, but data for this value is included in the calculated measures. |
|
|
Filtered: The dimension value does not appear in the cube, and is not included in the calculated measures. |
|
|
Toggle dimension state: visible -> invisible -> filtered -> visible. |
|
|
Add hierarchy group. A hierarchy group allows you to group similar values together. |
|
|
Delete hierarchy group. |
|
|
Expand/collapse tree nodes. |
|
|
Sort dimensions in the specified order. |
|
|
Accept changes and close screen. |
|
|
Cancel changes and close screen. |
|
|
Open Help. |
Need More Help?
If you need additional help creating OLAP Cubes, refer to Getting Started with OLAP Cubes.